def ddxdtt(x, dxdt, mu):
    return mu * (1 - x**2) * dxdt - x
ddxdtt(1, 1, 1)
-1
def dudt(u, mu):
    x, dxdt = u
    dudt = array([dxdt, ddxdtt(x, dxdt, mu)])
    return dudt
dudt([1,1], 1)
array([ 1, -1])
from scipy.integrate import odeint

def run(u, mu, nsteps):
    x = empty(nsteps)
    for i in range(nsteps):
        u = odeint(lambda u,t : dudt(u, mu), u, [0, 0.01])[1]
        x[i] = u[0]
    return u, x
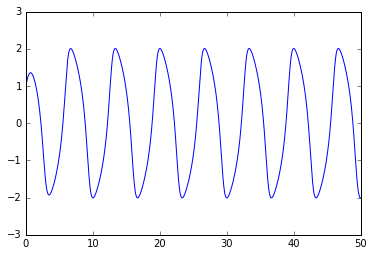
u, x = run([1, 1], 1, 5000)
%matplotlib inline
plot(0.01 * arange(x.size), x)
[<matplotlib.lines.Line2D at 0x7fa06a3cd190>]
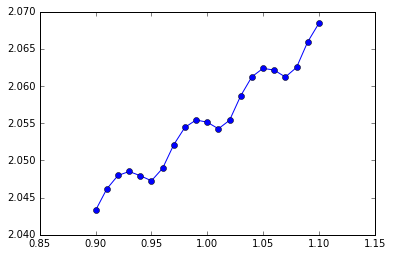
mu_array = linspace(0.9, 1.1, 21)
x2_mean = empty(mu_array.size)
for i, mu in enumerate(mu_array):
    _, x = run([1, 1], mu, 5000)
    x2_mean[i] = (x**2).mean()
plot(mu_array, x2_mean, 'o-')
[<matplotlib.lines.Line2D at 0x7fbbef019310>]
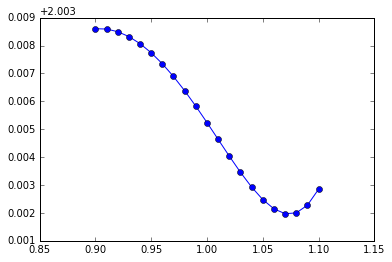
mu_array = linspace(0.9, 1.1, 21)
x2_mean = empty(mu_array.size)
for i, mu in enumerate(mu_array):
    _, x = run([1, 1], mu, 50000)
    x2_mean[i] = (x**2).mean()
plot(mu_array, x2_mean, 'o-')
[<matplotlib.lines.Line2D at 0x7fa06a3cda50>]
from fds import shadowing

def run_x2(u0, mu, nsteps):
    u, x = run(u0, mu, nsteps)
    return u, x**2

J, G = shadowing(run_x2, [1,1], 1, 1, 10, 500, 500)
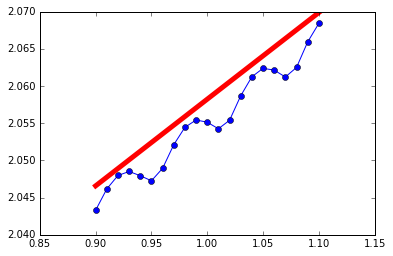
plot(mu_array, x2_mean, 'o-')
plot([0.9, 1.1], [J-0.1*G, J+0.1*G], '-r', lw=5)
[<matplotlib.lines.Line2D at 0x7fa06812f050>]